Annotation#
Annotation functions are useful for adding an additional level of information to your analyses. For example, they include functions for adding gene names to protein IDs or for adding pathway information to proteins.
Autoprot Annotation Functions.
@author: Wignand, Julian, Johannes
@documentation: Julian
- autoprot.visualization.annotation.i_lolli_plot(sty: DataFrame, proteinid: str, protein_length: int | None = None, columns: dict | None = None)[source]#
This function generates a lollipop plot representing PTM localization, intensity and localization probability. change the plotly io parameter if you have problems with rendering, see: pio.renderers.default = “jupyterlab”
- Parameters:
sty (pandas DataFrame) – Loaded sites table
proteinid (str) – Exact protein identifier to search in ids column (defined in columns dictionary).
protein_length (int or None, default = None) – Optional maximum value for the x-axis. If None the maximum site position+20 is used.
columns (dict, default = MaxQuant sites table names) –
- Dictionary that defines the column names for:
ids: semicolon separated protein identifiers
pos: semicolon separated site positions
- int: single column containing site intensity (or other quantitative parameter; will be log10 transformed)
This defines the y-axis position/length of the lollipop.
- prob: single column containing localization probability
This defines the relative size of the lollipop
- Returns:
a pandas DataFrame – contains filtered and transformed data used for plotting
a plotly Figure – interactive lollipop plot
- autoprot.visualization.annotation.i_mirror_lolli_plot(sty1: DataFrame, sty2: DataFrame, proteinid: str, protein_length: int = None, name1: str = None, name2: str = None, columns1: dict | None = None, columns2: dict | None = None) tuple[tuple[DataFrame | None, DataFrame | None], Figure][source]#
This function generates an interactive mirrored lollipop plot representing PTM localization, intensity and localization probability of a protein from 2 measurements. change the plotly io parameter if you have problems with rendering, see: pio.renderers.default = “jupyterlab”
- Parameters:
sty1 (pandas DataFrame) – Loaded sites table
sty2 (pandas DataFrame) – Loaded sites table
proteinid (str) – Exact protein identifier to search in ids column (defined in columns dictionary).
protein_length (int or None, default = None) – Optional maximum value for the x-axis. If None the maximum site position+20 is used.
name1 (str, default =None) – name for legend and hoverdata, name1 for upper graph, name2 for mirrowed graph
name2 (str, default =None) – See name1
columns1 (dict, default = MaxQuant sites table names, seperate for sty1 and sty2) –
- Dictionary that defines the column names for:
ids: semicolon separated protein identifiers
pos: semicolon separated site positions
- int: single column containing site intensity (or other quantitative parameter; will be log10 transformed)
This defines the y-axis position/length of the lollipop.
- prob: single column containing localization probability
This defines the relative size of the lollipop
columns2 (dict, default = MaxQuant sites table names, seperate for sty1 and sty2) – See columns1
- Returns:
Tuple of two pandas DataFrames or None – contains filtered and transformed data used for plotting None if no data is available
Plotly Figure – interactive lollipop plot
- autoprot.visualization.annotation.isequence_logo(df, motif, rename_to_st=False, ret_fig=False)[source]#
Plot interactive sequence logo
- Parameters:
df (pd.DataFrame) – The dataframe from which experimentally determined sequences are extracted.
motif (tuple of str) – A tuple of the sequence_motif and its name. The phospho site residue in the sequence_motif should be indicated by a lowercase character. Example (“..R.R..s…….”, “MK_down”).
rename_to_st (bool, optional) – If true, the phospho residue will be considered to be either S or T. The default is False.
ret_fig (bool, optional) – Whether to return the figure object.
- Returns:
plotly.figure
- Return type:
The interactive figure object
- autoprot.visualization.annotation.ptm_lolli_plot(sty: DataFrame, proteinid: str, protein_length: int | None, columns: dict | None = None, scale: bool = False)[source]#
This function generates a static lollipop plot representing PTM localization, intensity and localization probability.
- Parameters:
sty (pandas DataFrame) – Loaded sites table
proteinid (str) – Exact protein identifier to search in ids column (defined in columns dictionary).
protein_length (int or None, default = None) – Optional protein length for the x-axis. If None the maximum site position+20 is used.
columns (dict, default = MaxQuant sites table names) –
- Dictionary that defines the column names for:
ids: semicolon separated protein identifiers
pos: semicolon separated site positions
- int: single column containing site intensity (or other quantitative parameter; will be log10 transformed)
This defines the y-axis position/length of the lollipop.
- prob: single column containing localization probability
This defines the relative size of the lollipop
scale (bool, default=False) – Min-Max-Scaling of Intensity columns
- Returns:
a pandas DataFrame – contains filtered and transformed data used for plotting
a matplotlib plyplot Figure – static lollipop plot
- autoprot.visualization.annotation.ptm_mirror_lolli_plot(sty1: DataFrame, sty2: DataFrame, proteinid: str, protein_length: int = None, columns1: dict | None = None, columns2: dict | None = None, scale: bool = False)[source]#
This function generates a static, mirror lollipop plot representing PTM localization, intensity and localization probability.
- Parameters:
sty1 (pandas DataFrame) – PTM sites table 1
sty2 (pandas DataFrame) – PTM sites table 2
columns1 (dict or None, default = MaxQuant sites table names) –
- Dictionary that defines the column names for:
ids: semicolon separated protein identifiers
pos: semicolon separated site positions
- int: single column containing site intensity (or other quantitative parameter; will be log10 transformed)
This defines the y-axis position/length of the lollipop.
- prob: single column containing localization probability
This defines the relative size of the lollipop
- aa: single column containing modified amino acid for annotation
this is used together with the “pos” for annotation of the PTM position
columns2 (dict or None, default = MaxQuant sites table names) – See columns1
proteinid (str) – Exact protein identifier to search in ids column (defined in columns dictionary).
protein_length (int or None, default = None) – Optional protein length for the x-axis. If None the maximum site position+20 is used.
scale (bool, default=False) – Min-Max-Scaling of Intensity columns
- Returns:
a pandas DataFrame – contains filtered and transformed data used for plotting
a matplotlib plyplot Figure – static lollipop plot
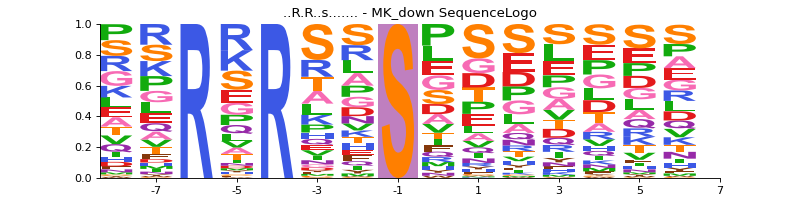
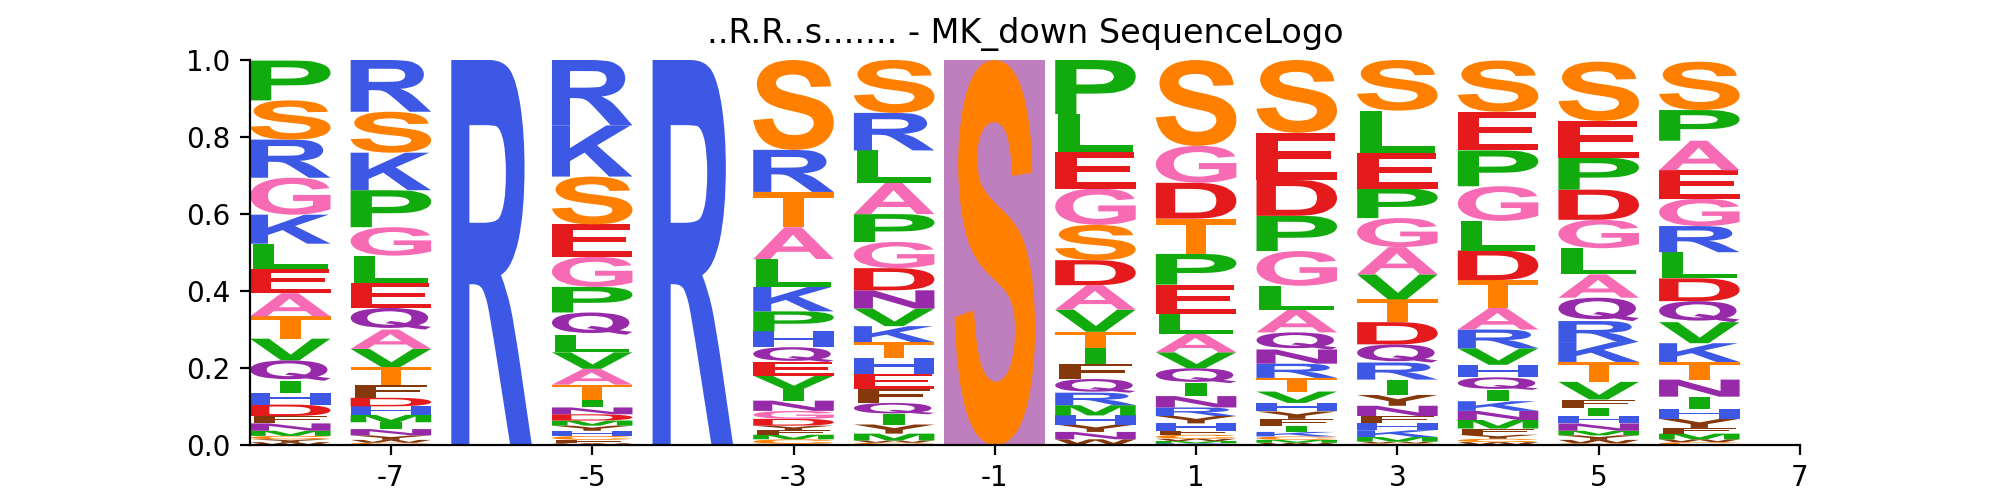
- autoprot.visualization.annotation.sequence_logo(df, motif, file=None, rename_to_st=False)[source]#
Generate sequence logo plot based on experimentally observed phosphosites.
- Parameters:
df (pd.DataFrame) – The dataframe from which experimentally determined sequences are extracted.
motif (tuple of str) – A tuple of the sequence_motif and its name. The phosphosite residue in the sequence_motif should be indicated by a lowercase character. Example (“..R.R..s…….”, “MK_down”).
file (str) – Path to write the figure to outfile_path. Default is None.
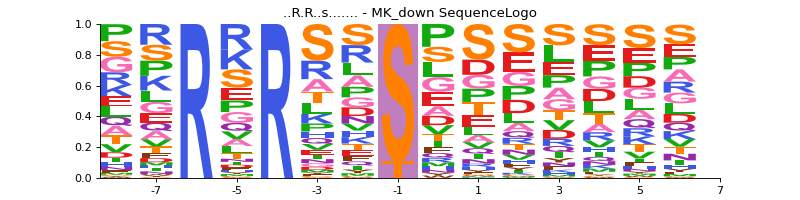
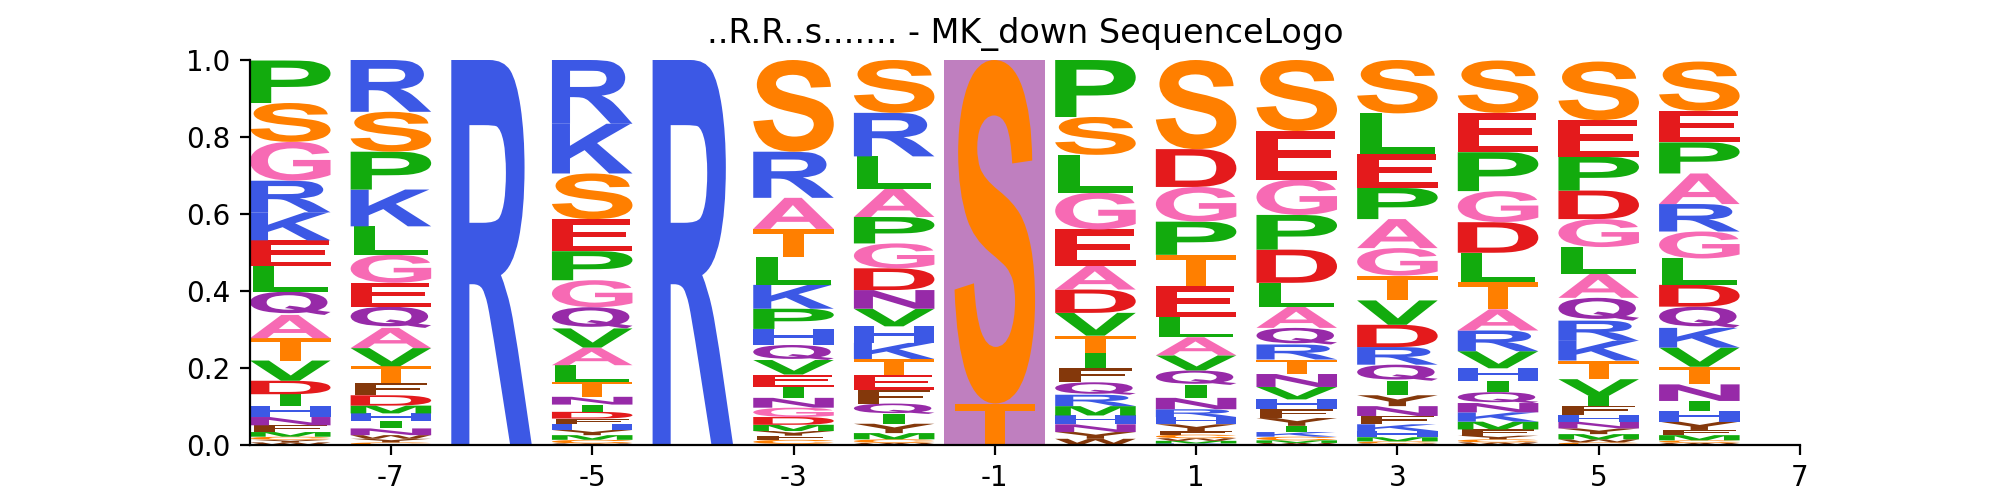
rename_to_st (bool, optional) – If true, the phoshoresidue will be considered to be either S or T. The default is False.
- Raises:
ValueError – If the phosphoresidue was not indicated by lowercase character.
- Return type:
None.
Examples
First define the sequence_motif of interest. Note that the phosphorylated residue should be marked by a lowercase character.
sequence_motif = ("..R.R..s.......", "MK_down")
vis.sequence_logo(phos, sequence_motif)
(
Source code,png,hires.png,pdf)
allow s and t as central residue
sequence_motif = ("..R.R..s.......", "MK_down")
vis.sequence_logo(phos, sequence_motif, rename_to_st=True)
(
Source code,png,hires.png,pdf)
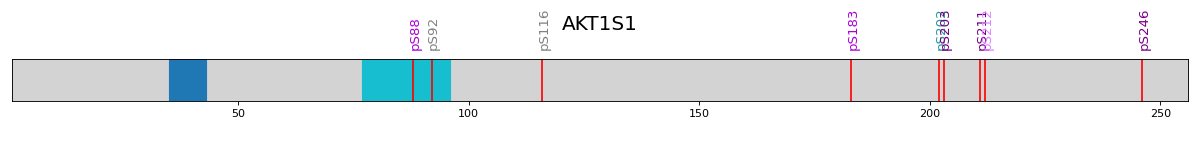
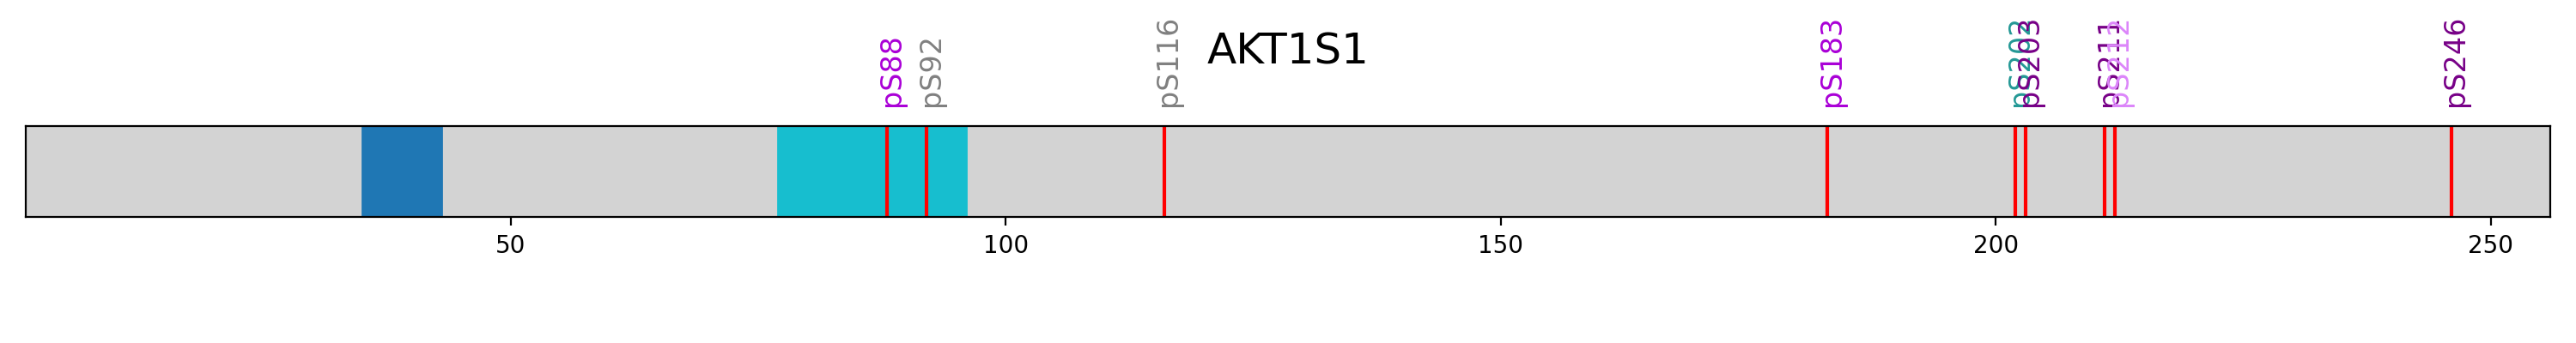
- autoprot.visualization.annotation.vis_psites(name: str, length: int, domain_position: list[tuple[int]] | None = None, ps: list[int] | None = None, pl: list[str] | None = None, plc: list[str] | None = None, pls: int = 4, ax: Axes = None, domain_color: str = 'tab10', ret_fig: bool = False)[source]#
Visualize domains and phosphosites on a protein of interest.
- Parameters:
name (str) – Name of the protein. Used for plot title.
length (int) – Length of the protein.
domain_position (list of tuples of int) – Each element is a tuple of domain start and end postiions.
ps (list of int) – position of phosphosites.
pl (list of str) – label for ps (has to be in same order as ps).
plc (list of colours) – optionally one can provide a list of colors for the phosphosite labels.
pls (int, optional) – Fontsize for the phosphosite labels. The default is 4.
ax (matplotlib axis, optional) – To draw on an existing axis
domain_color (str) – Either a matplotlib colormap (see https://predictablynoisy.com/matplotlib/gallery/color/colormap_reference.html) or a single color
ret_fig (bool) – Return fig as element. Default set to False.
- Returns:
The figure object.
- Return type:
matplotlib.figure
Examples
Draw an overview on the phosphorylation of AKT1S1.
>>> name = "AKT1S1"
>>> length = 256
>>> domain_position = [(35,43),
...                    (77,96)]
>>> ps = [88, 92, 116, 183, 202, 203, 211, 212, 246]
>>> pl = ["pS88", "pS92", "pS116", "pS183", "pS202", "pS203", "pS211", "pS212", "pS246"]
colors (A,B,C,D (gray -> purple), Ad, Bd, Cd, Dd (gray -> teal) can be used to indicate regulation)
>>> plc = ['C', 'A', 'A', 'C', 'Cd', 'D', 'D', 'B', 'D']
>>> autoprot.visualization.vis_psites(name, length, domain_position, ps, pl, plc, pls=12)
name = "AKT1S1"
length = 256
domain_position = [(35,43),
                   (77,96)]
ps = [88, 92, 116, 183, 202, 203, 211, 212, 246]
pl = ["pS88", "pS92", "pS116", "pS183", "pS202", "pS203", "pS211", "pS212", "pS246"]
plc = ['C', 'A', 'A', 'C', 'Cd', 'D', 'D', 'B', 'D']
vis.vis_psites(name, length, domain_position, ps, pl, plc, pls=12)
plt.show()
(
Source code,png,hires.png,pdf)